 Photo illustration courtesy the researchers
Tracking smoke
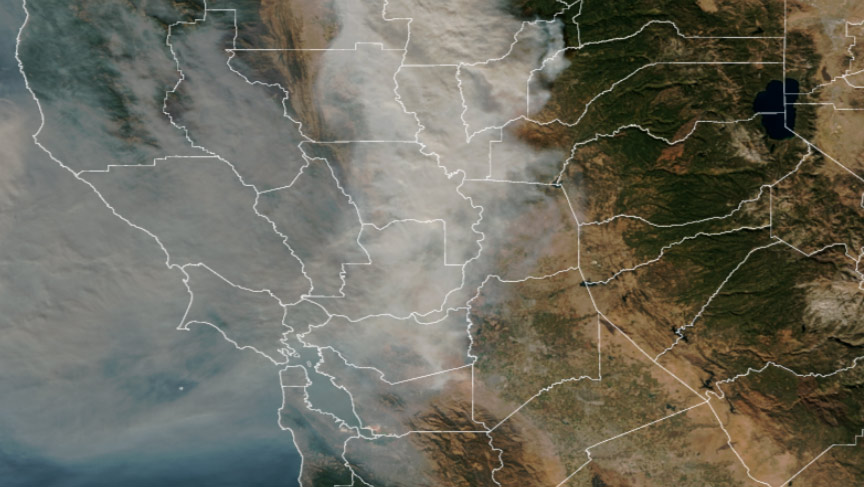
During the 2018 Camp Fire, Tina Katopodes Chow, professor of civil and environmental engineering, went looking for information on when the smoke might clear from the San Francisco Bay Area — more than 100 miles away from the wildfire raging in Butte County, California. What she found was a new experimental tool from the National Oceanic and Atmospheric Administration (NOAA) Global Systems Laboratory. Known as HRRR-Smoke, it is the only real-time 3D high-resolution U.S. weather forecasting model that predicts the movement and concentration of smoke. Using data collected by weather satellites, such as the radiative energy from a fire, the model estimates the amount of smoke emitted; it then computes wind speed and direction to predict the smoke plume’s trajectory, density and impact on weather and visibility.
After noticing some inaccuracies, Chow contacted the developers and offered to help test the model. Her team’s analysis found that HRRR-Smoke successfully forecast the general movement and concentration of the smoke plume, especially given the complex terrain and wind conditions. But it also identified aspects of the model that could be improved — such as how the arrival of smoke in the Bay Area as predicted by the model was delayed. Including high-frequency fire detections from geostationary satellites would help fires be detected more rapidly in the model, said Katelyn Yu, Ph.D. student and co-author of the study.
On some days, the model underpredicted the concentration of air pollution by 70%; the researchers believe that the smoke plume itself may be the cause of this error because the thick smoke blocked the satellites’ view of the fire. “To complement the satellite detections, we need to assimilate additional datasets into our smoke forecast models, for example the ground-based PM2.5 measurements,” said Chow, noting that NOAA researchers are continuing to improve the HRRR-Smoke model, which became operational in 2020.

